[03/04/2022] All the TAR files listed below have been replaced, to fix a small mistake in the wavelength CDELT value in headers of the averages.
Average spectra of cool giants
In the XSL stellar population models, we give extra attention
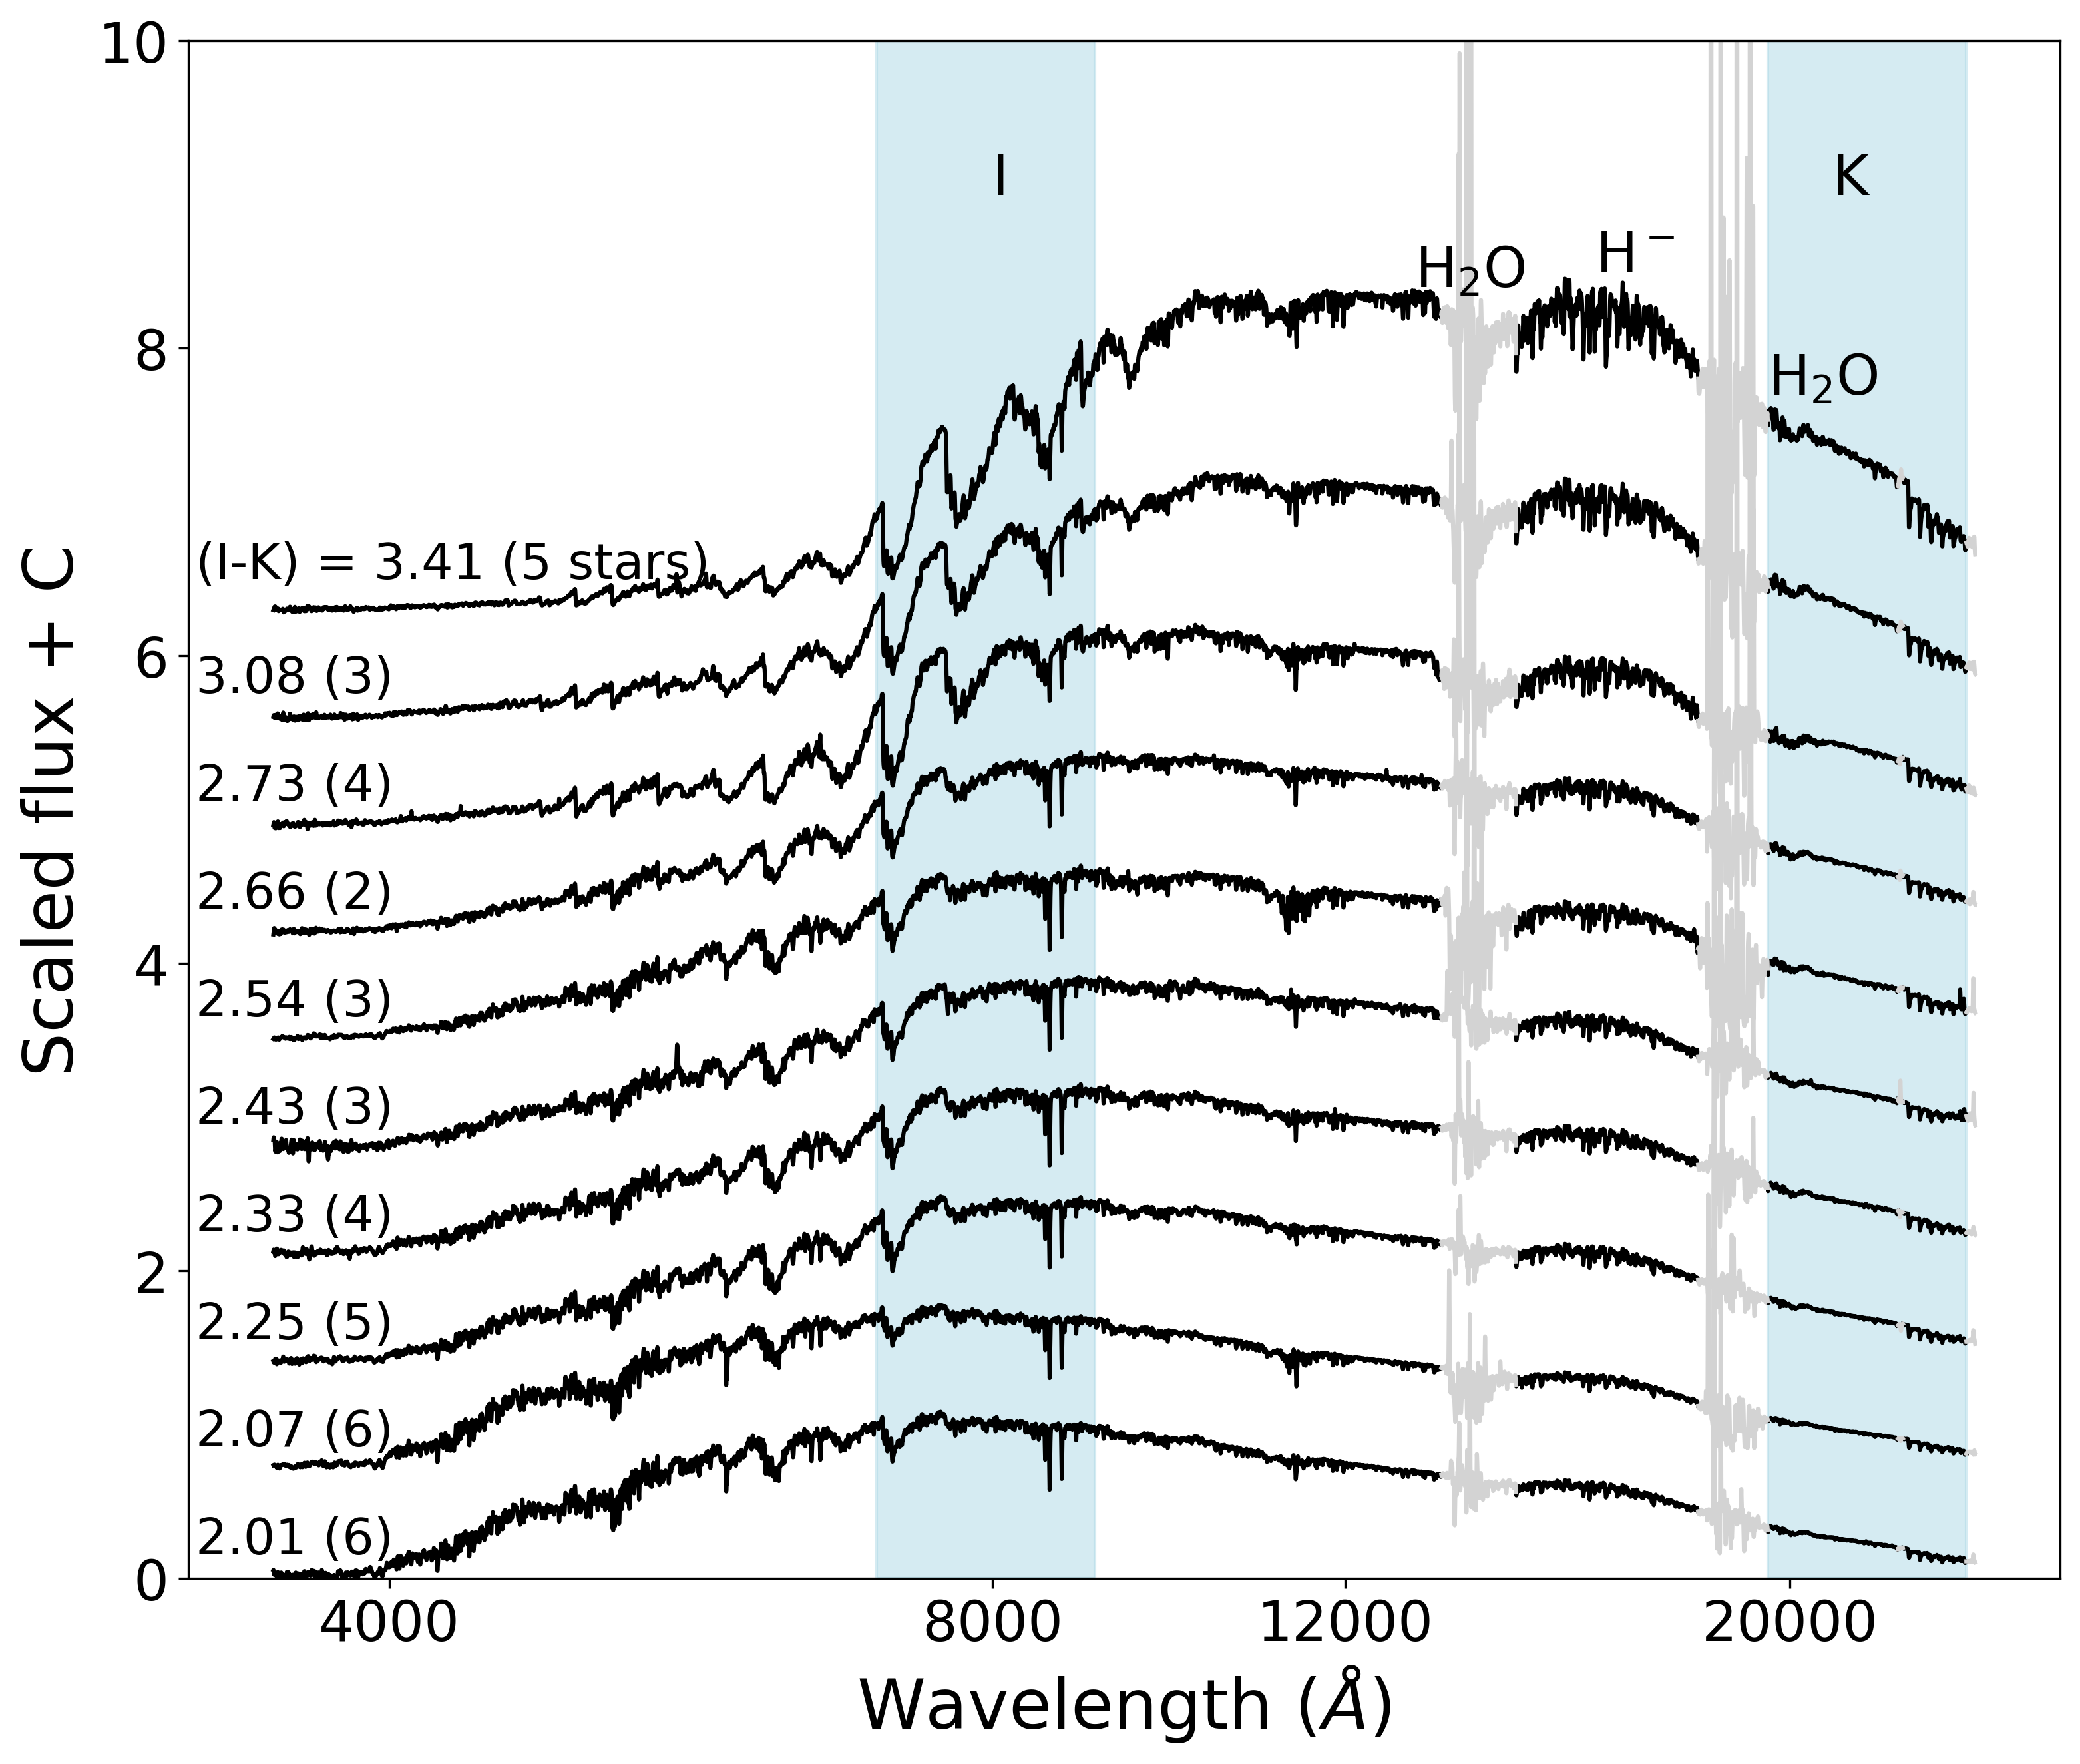
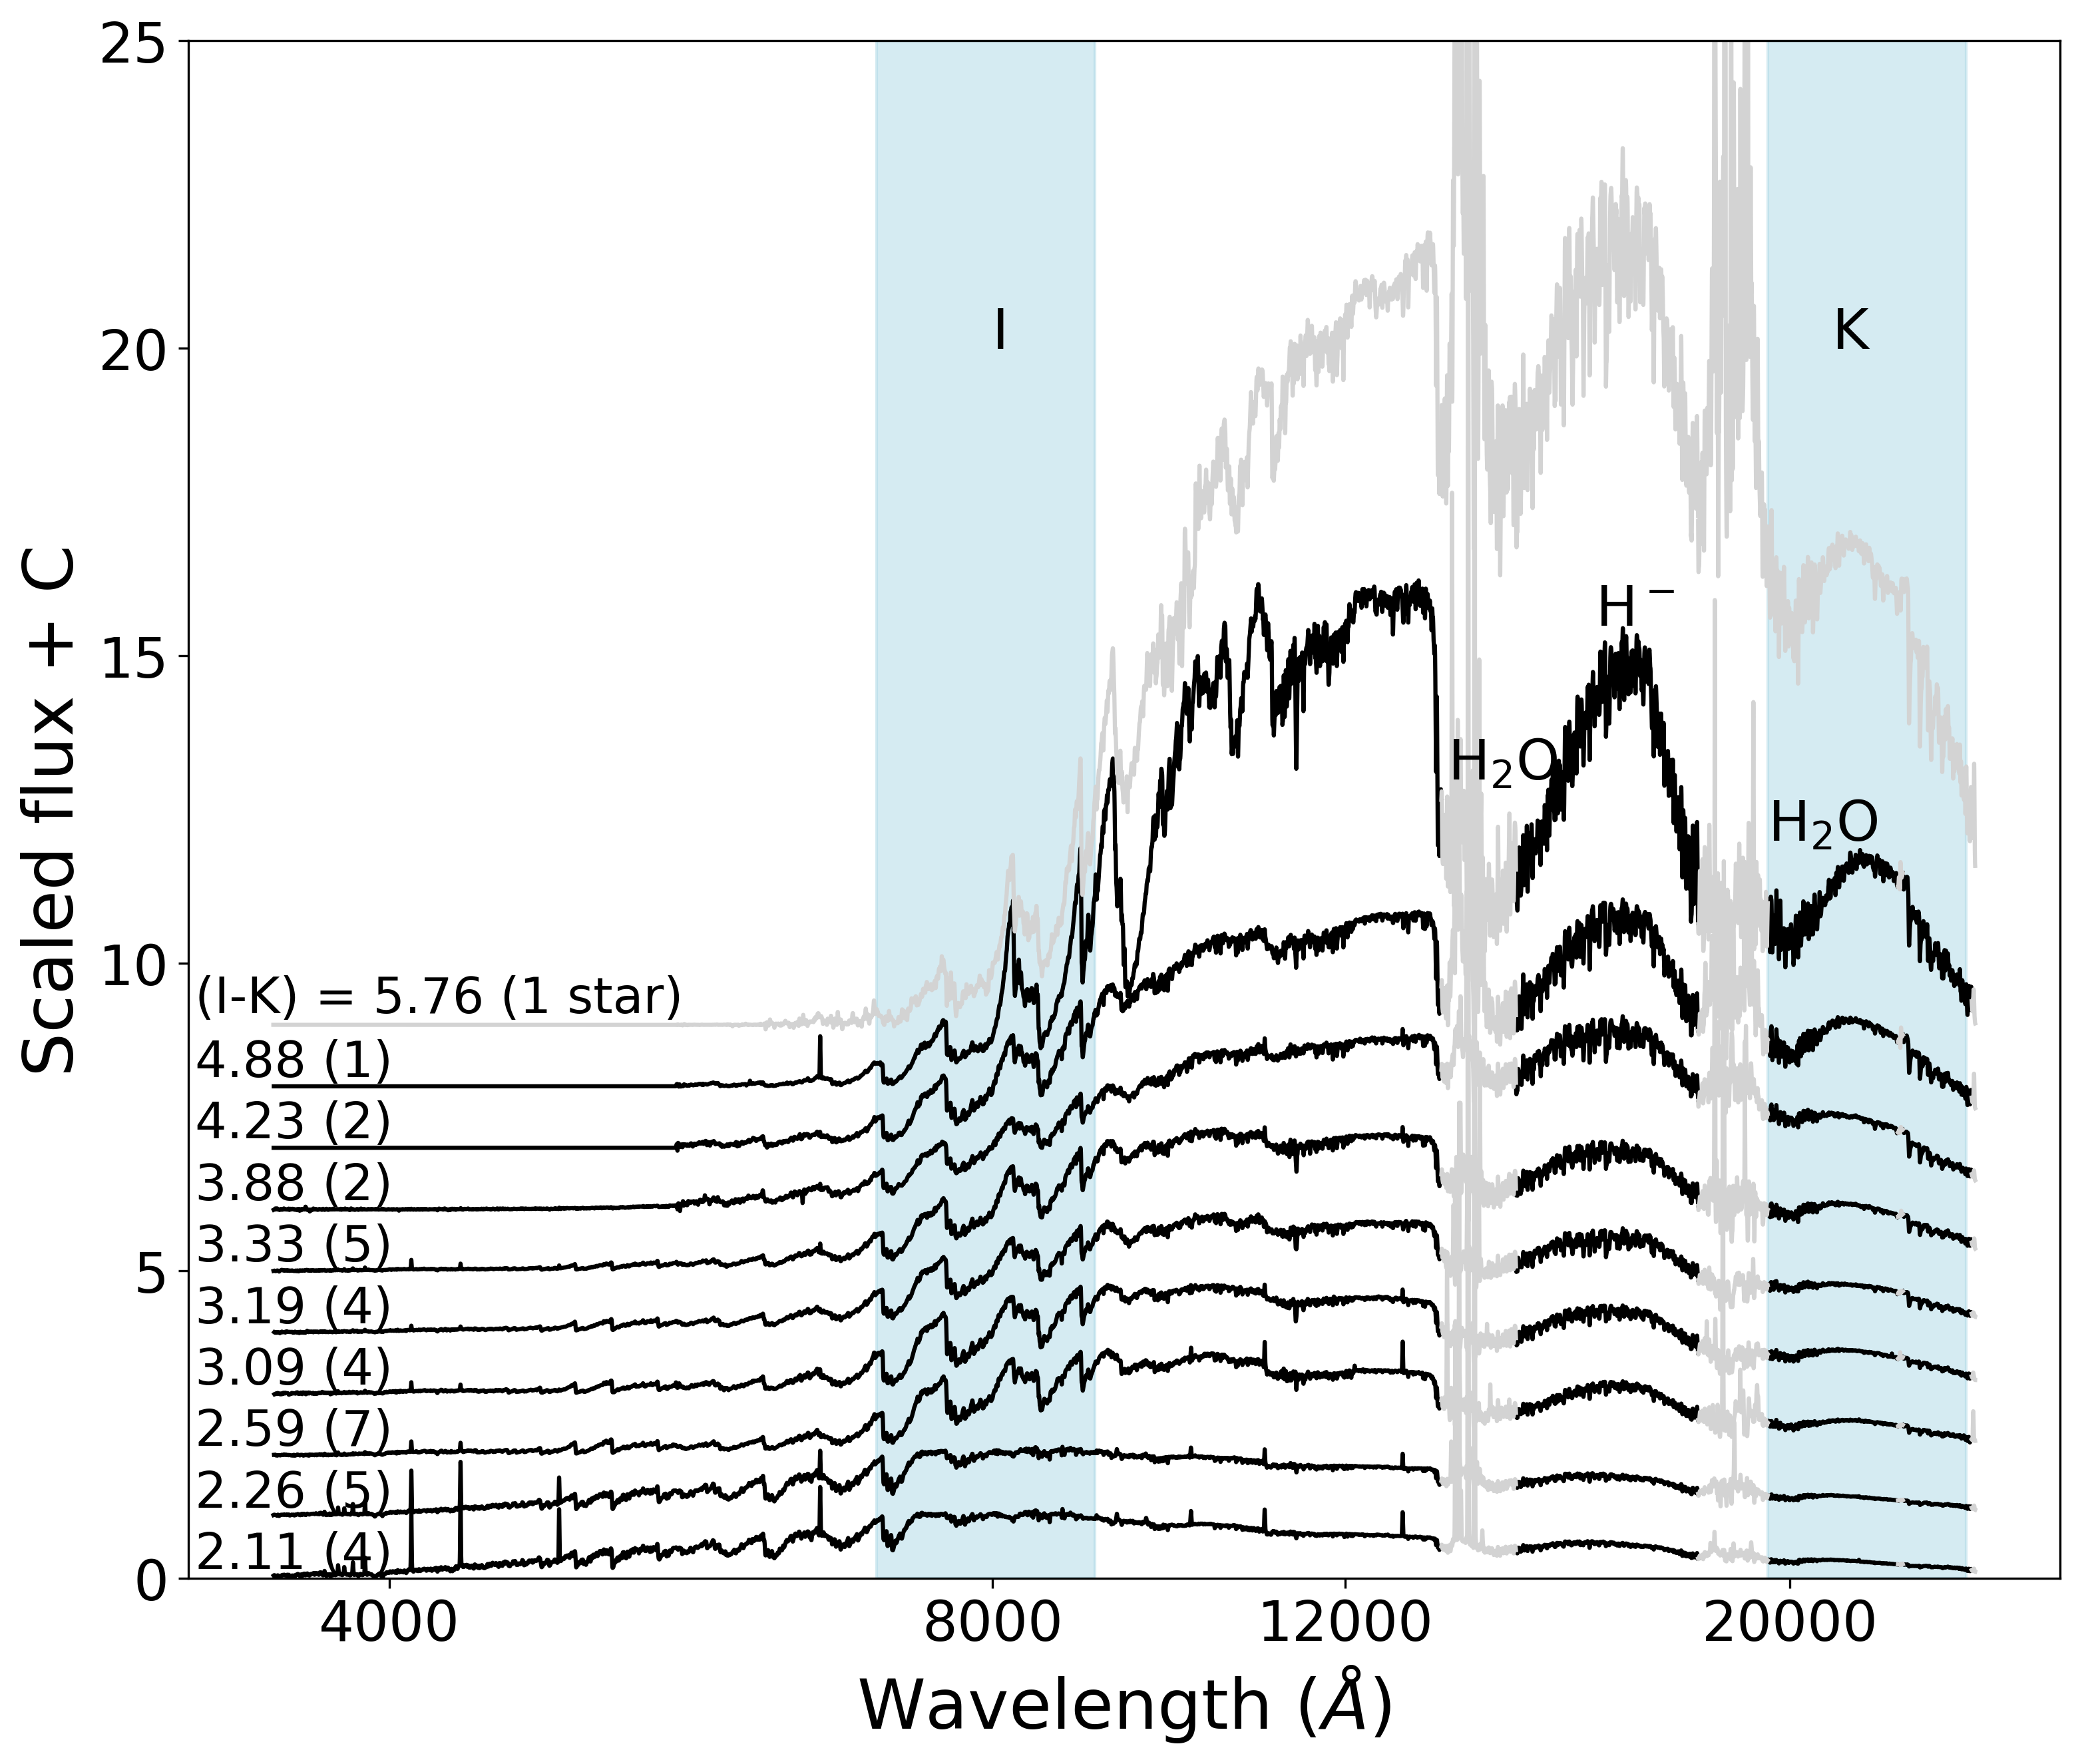
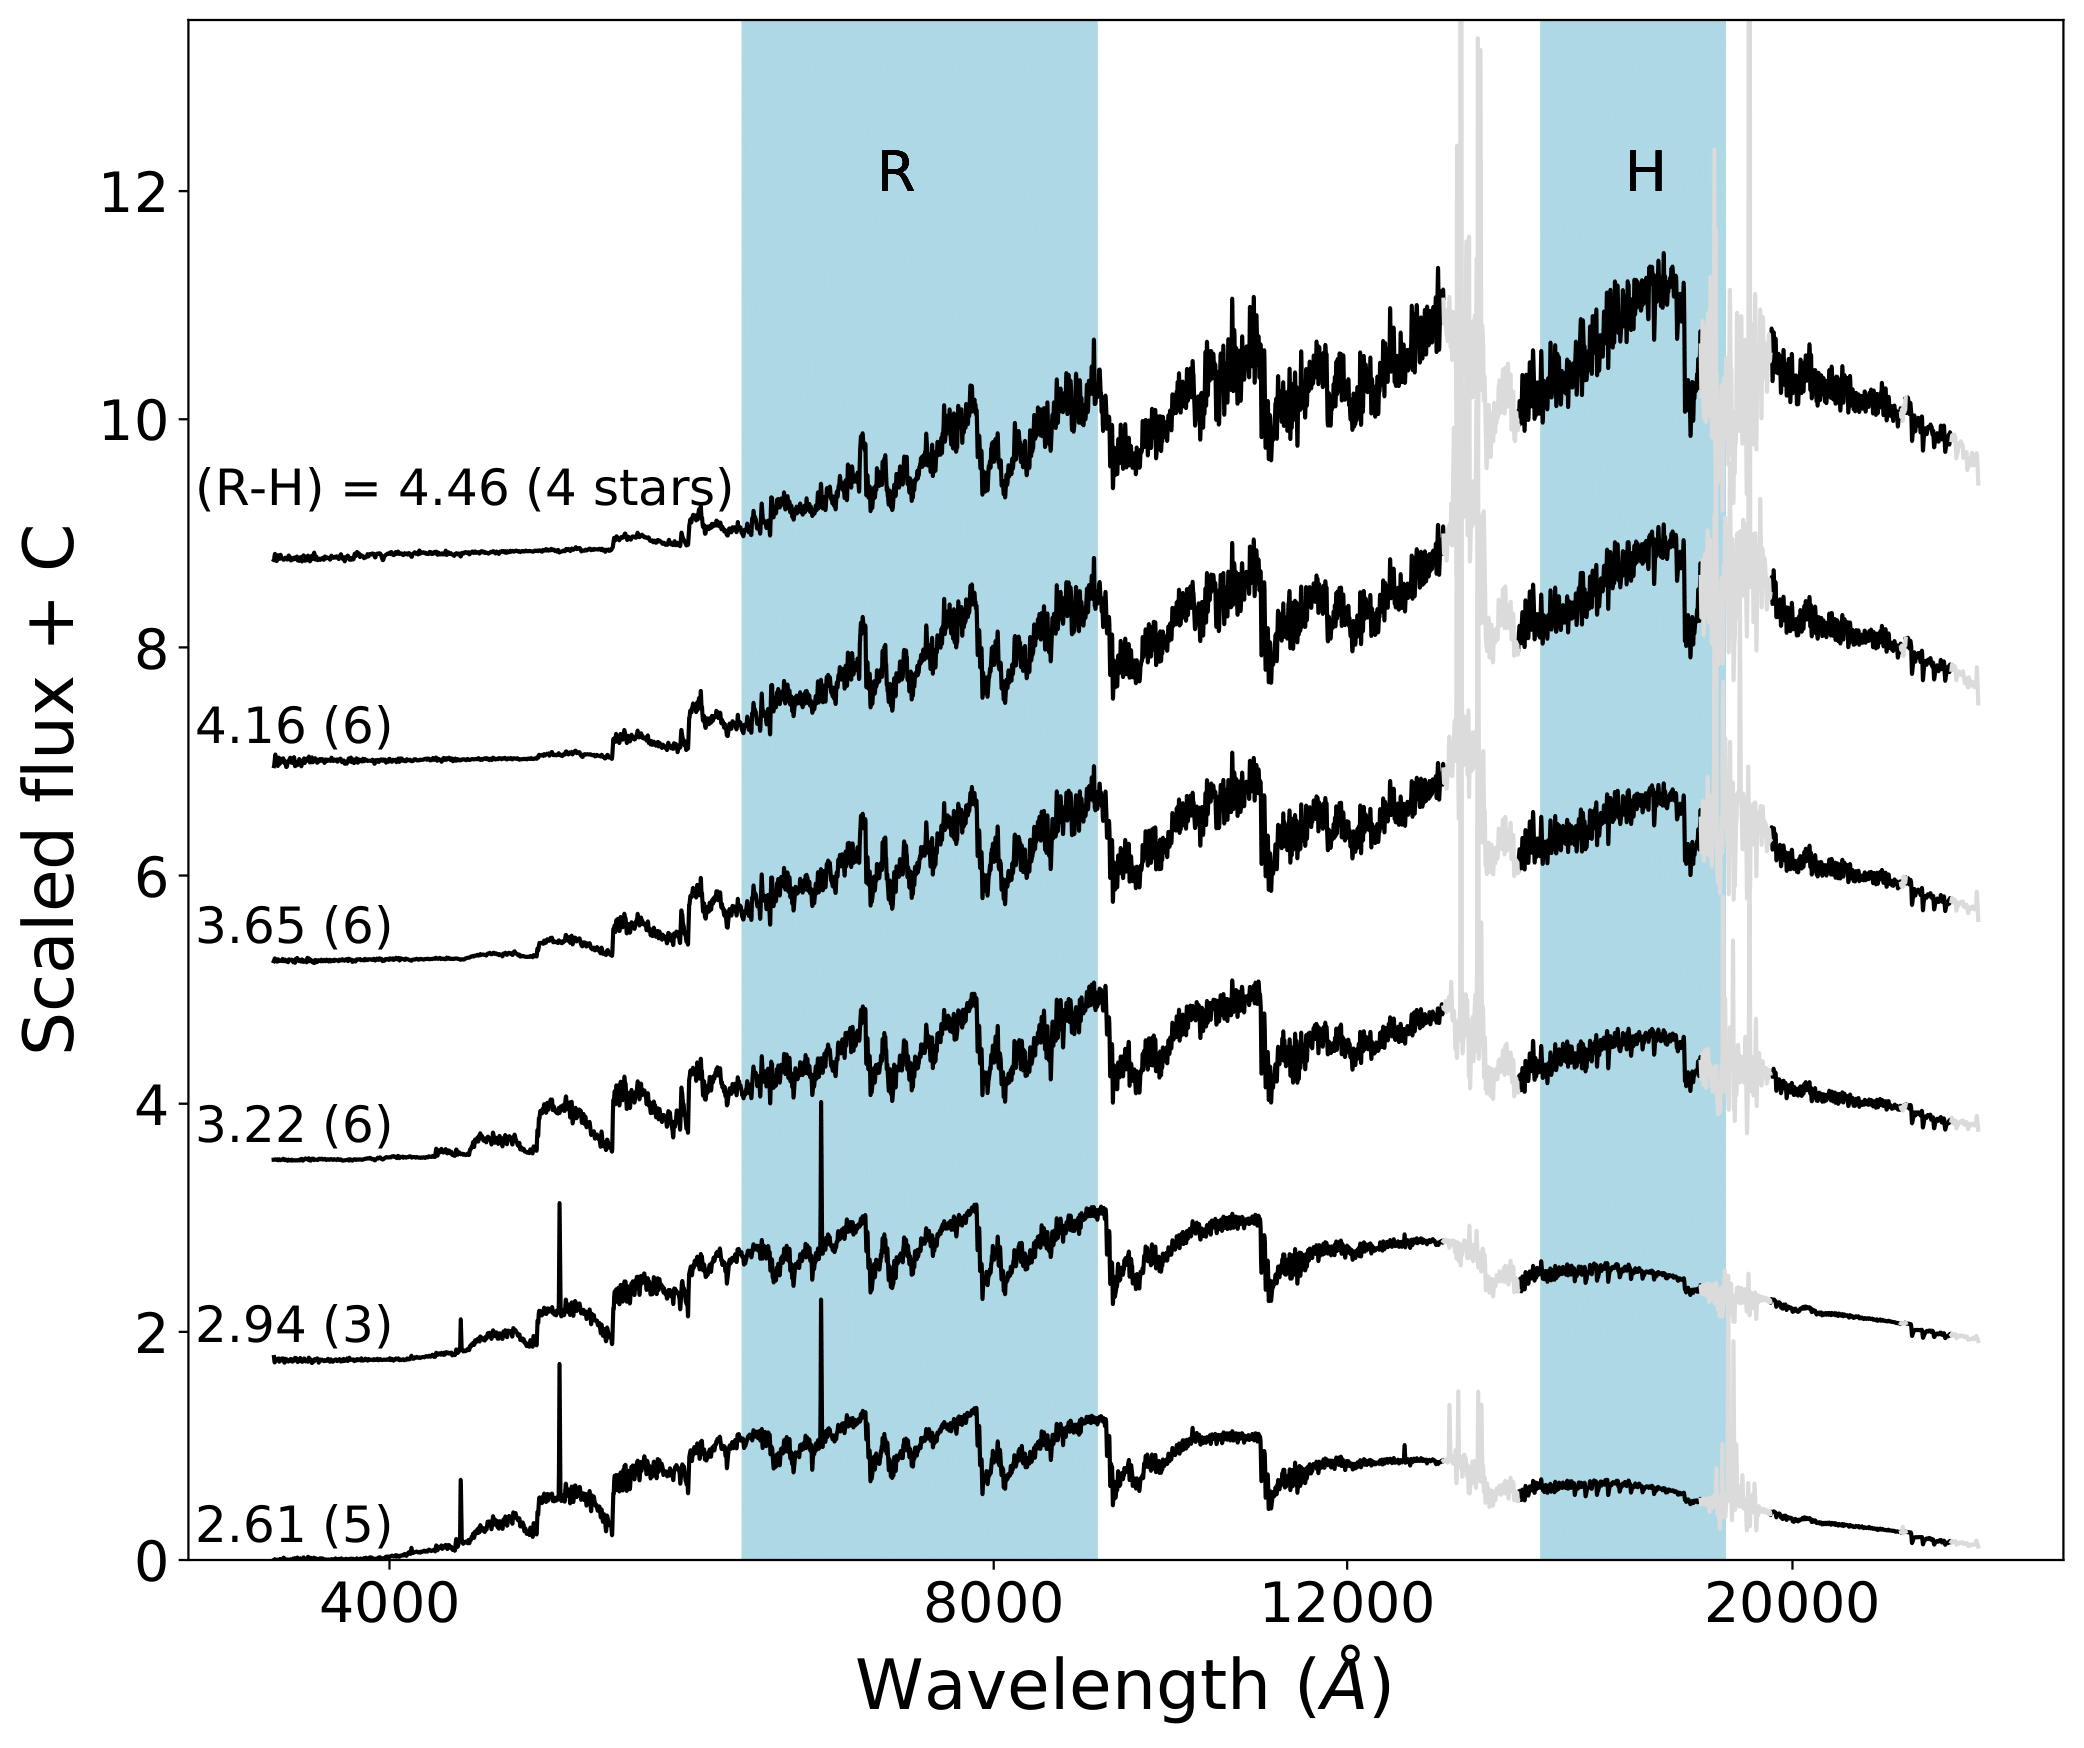
to the cool (Teff < 4000 K) evolved giants. We divide these stars into (O-rich) static giants, O-rich TP-AGB stars and C-rich
TP-AGB (‘carbon’) stars. We have used the average spectra of these stars, binned by broad-band colour to incorporate these stars
into our stellar population models. You can download these average spectra below. See
Verro et al. (2022b) for details.
Average spectra of cool giants are provided as FITS files, each containing the flux column. The wavelength information (log10 sampled, in nm) is provided in the header keywords: CRVAL1, CDELT1, CRPIX1.